The search for performance
All the context
I recently began on a journey to discover performance issues in Ironic. In part, because I made changes to improve operational security capabilites to users which we knew would have some impact and our amazing friends at CERN encountered an unrelated performance issue.
This somewhat sent me on a mission. A mission to improve performance!
But everyone's performance issues can vary based upon multiple factors.
It is one of the reasons we don't talk about scaling. We will talk about the rich concepts and capabilities available to scale a deployment, and intend to write about this soon, but what people tend to seek is aspects like raw counts of nodes per conductors. But does the conductor have multiple CPUs or one CPU? Are you using IPMI or Redfish? Is your storage performant... or not? Are you using a centralized message bus, or is everything just installed on one laptop that is toated from rack to rack. All of these things drasticaly impact performance in different ways.
Unfortunately, Ironic has to take a solid portion of blame for performance. Maybe blame is the wrong word. The application architecture supports the ability split and distribute distinct tasks while also offering the capability to support rolling updates and online data migration between versions. At the same time, the project and it's capabilities have evolved organically over time.
And, in that organic evolution, we never built tooling to provide developer and troubleshooter friendly tools to make it easier to evaluate some of these things and comprehend the enviroment and it's data. And I wish we had these tools, of course, in the end, I had to add numerous print statements into the code to precisely time exactly what is occuring. But I'm alluding too quickly.
Disclaimer
This exploration took place on a version of ironic from the upstream development branch released after the release of Ironic 17.0. I anticipate fixes noted in this to be in Ironic 18.0 which we're hoping to be released soon, and backported in the future.
The journey to improvement
In starting, we knew of an obvious performance deficit. The database, query performance, and resource contention between conductors. This somewhat was led by the issue raised by our friends at CERN where the internal task model was causing additional queries to be exectued automatically for objects which were not used. This was re-tooled to lower the average concurrent query count amonst their twenty-plus conductors managing their baremetal hardware.
I'll present a mild warning at this moment, all numbers below are from a virtual machine on my personal desktop. I may, or may not had a StarShip launch stream running in the background on this computer, but I was able to reproduce these numbers under a few different conditions, even with the headache of Thermal Throttling was a thing.
Database Indexes, Result sets, and SQLAlchemy
And so, I started looking at adding indexes. This was surprisingly easy for me as someone who has spent substantial time working on databases. The headache was creating some mock data to exercise this, and then measuring it.
Then I had to remember the way SQLAlchemy worked when you use an Object Relationship Model. Long story short, it downloads the entire object, and then assembles the object. So indexes only help so much. They help for query concurrency and raw result set generation. And then I remembered, exactly why they say to never run "select *" on your SQL queries, because all of the columns are collected for the result set.
The answer was to restrict the query down to specific columns. Turns out, that is not entirely honored in Ironic's database access code. This shall be fixed.
Red herrings of Objects
When consulting the SQLAlchemy documentation, it is easy to to jump down the path of thinking that all of the object generations are part of the latency between getting the result set, downloading the result set, and then converting the result set to objects, which are then transformed and supplied to the API consumer.
Exploring this, and after numerous print statements into the code, it became clear the policy enforcement and sanitization code uses a substantial portion of the time to generate and return the result sets.
And then I started beating myself up, since this was code I recently modified. I created part of this issue, or at least compounded it further.
So I have a path forward, to just keep things simple and only do the needful, not extra work. It turned out taking this approach makes things even faster. We tend to error on the side of caution. To always expect to do certian tasks, but rarely stop to check if we need to take an extra step.
End results
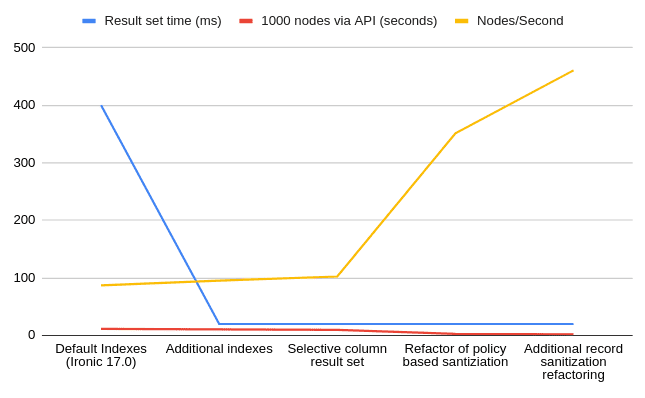
In the end, It appears we're able to squeeze out quite a bit more performance out of the API through a series of changes and improvements. Some of these these changes may not be feasible. Some may take a little more work. Most should be able to be backported to older versions, but that remains to be seen. In the mean time, I'll leave you with a graph.... including a little more fine tuning and addressing the afternoon heat causing some thermal throttling.

And now, you've read the story of how I found a way to improve Ironic's performance dramatically!
Feel free to join us in #openstack-ironic on irc.oftc.net if you have any questions.